Search data by region...
JHU has stopped collecting data as of
03 / 10 / 2023
After three years of around-the-clock tracking of COVID-19 data from...
Maps & Trends
Track COVID-19 Trends Across The U.S.
See where cases are rising and falling for all 50 states
Share:

AlabamaAlaskaArizonaArkansasCaliforniaColoradoConnecticutDelawareDistrict of ColumbiaFloridaGeorgiaHawaiiIdahoIllinoisIndianaIowaKansasKentuckyLouisianaMaineMarylandMassachusettsMichiganMinnesotaMississippiMissouriMontanaNebraskaNevadaNew HampshireNew JerseyNew MexicoNew YorkNorth CarolinaNorth DakotaNorthern Mariana IslandsOhioOklahomaOregonPennsylvaniaPuerto RicoRhode IslandSouth CarolinaSouth DakotaTennesseeTexasUtahVermontVirgin IslandsVirginiaWashingtonWest VirginiaWisconsinWyoming
About this page:
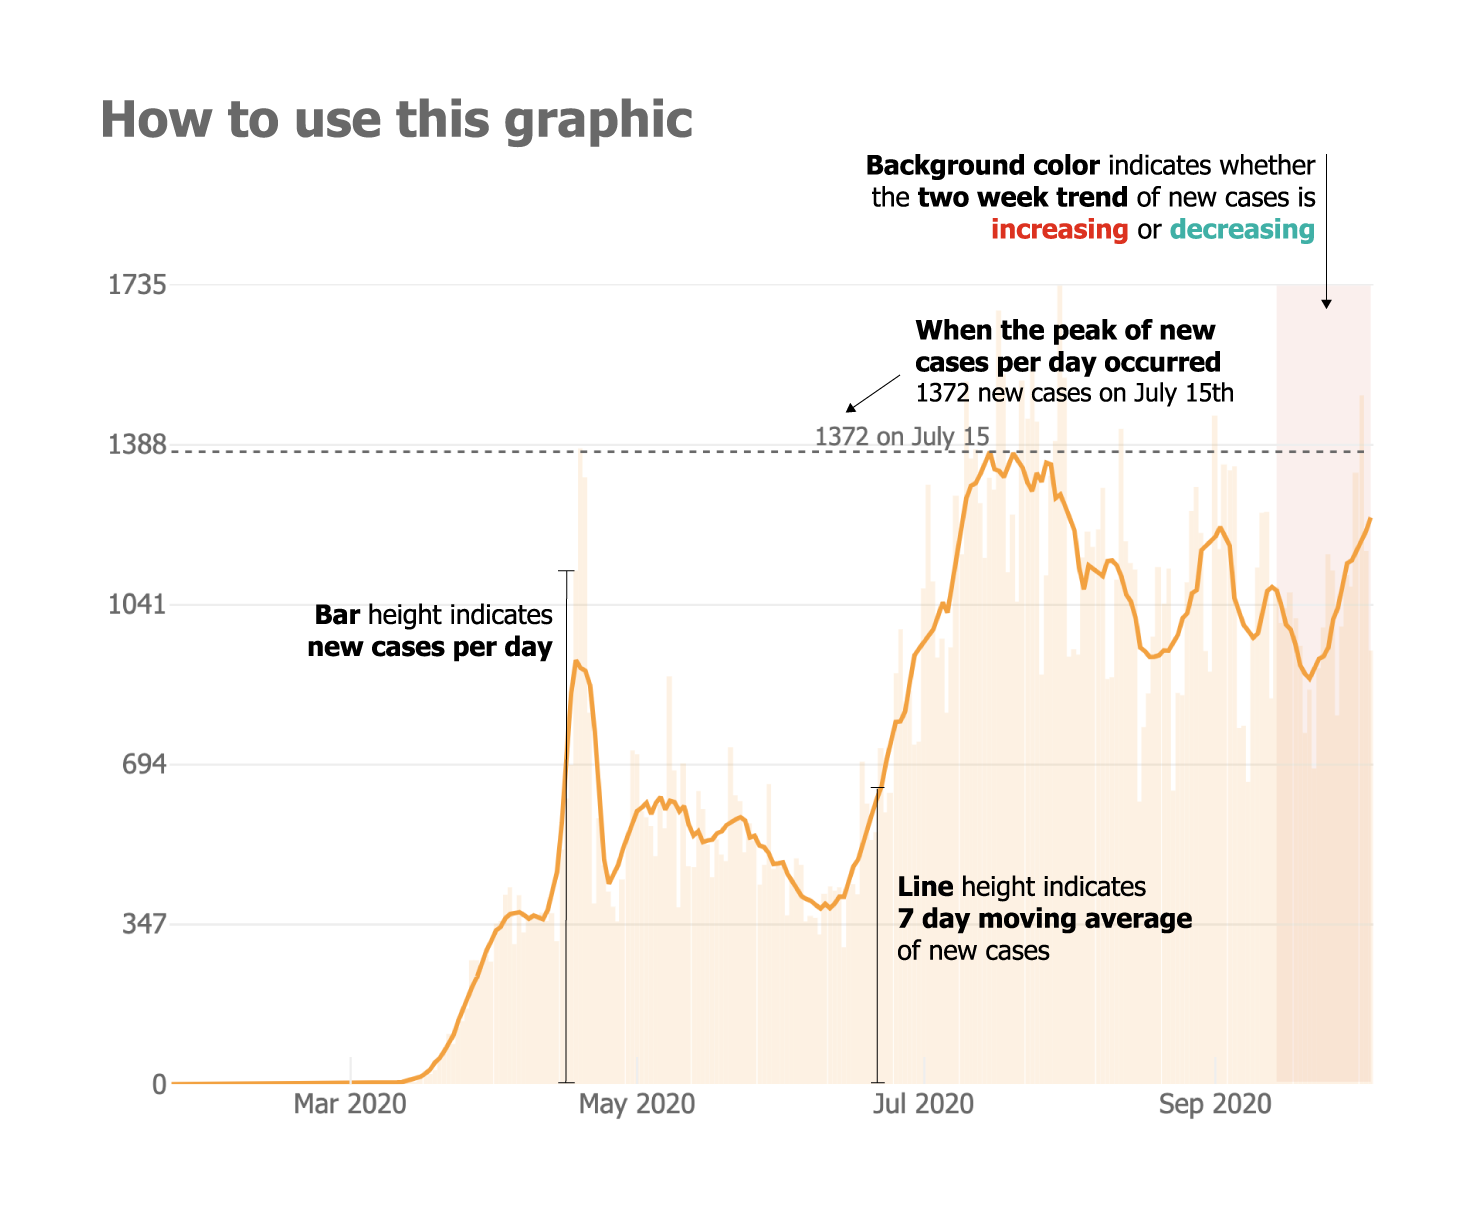
Outbreak evolution for the 50 states, D.C, and Puerto Rico
Daily new cases (7-day moving average)
Federal guidelines advise that states wait until they experience a downward trajectory of documented cases within a 14-day period before proceeding to a phased opening. In the state-specific view of the graph, this two-week period is highlighted in orange if cases are trending upward, or green if they are trending down.