Quantifying Community Resilience to Equip Local Government
Measuring community resilience will be an important metric as the nation emerges from the pandemic and prepares for the next crisis. Johns Hopkins COPEWELL helps quantify resilience to better inform local leaders.
While we have primarily focused on pandemic policy changes needed at the federal and state levels, actions at the community level are also incredibly important. During an earlier interview, Dr. Cheryl Himmelfarb explained how establishing strong connections with local communities is a key component of improving healthcare and medical research. The same will be required of public health professionals to improve disease surveillance and crisis response. The ability of a system to tolerate and respond to crisis is called resilience, which is a topic we discussed in regards to healthcare systems through our conversations with Dr. Kathleen Sutcliffe and Dr. Kimia Ghobadi. In our latest Q&A, Dr. Crystal Watson proposed that more research and effort need to go into community resilience to better prepare for and respond to the next public health crisis. All of this leads me to consider the idea of community resilience, how to quantify it, and how to act on that data.
In the context of hospitals, resilience refers to how the system responds to increases in both demand and complexity of care, which clearly occurred throughout the COVID-19 pandemic, particularly during variant waves. This concept equally applies to communities. According to the U.S. Department of Health and Human Services, “community health resilience is the ability of a community to use its assets to strengthen public health and healthcare systems and to improve the community’s physical, behavioral, and social health to withstand, adapt to, and recover from adversity.”1
Understanding community resilience is important because it directly affects individuals and how they experience adversity. If the community as a whole is more resilient, the well-being of the people within it should be better, and the community should be able to bounce back to a state of normalcy more quickly following an emergency. As we now enter a phase in the pandemic where many people want to “return to normal” and leaders are anticipating a transition into an endemic phase,2 understanding how communities will recover and prepare for the next source of adversity will be critical.
Quantifying “adversity” has been fairly straightforward during the pandemic — case counts, hospital capacity, testing utilization and availability, and deaths are just some of the ways that experts have measured the current crisis. Resilience is a bit more difficult to assess. Fortunately, the Johns Hopkins Bloomberg School of Public Health has developed the Composite of Post-Event Well-Being (COPEWELL) model to synthesize data from a range of community measures and provide an assessment of resilience.
Just as some experts have found innovative ways to quantify human behavior and decision-making during the pandemic, there are a multitude of metrics that can be used to measure community resilience. COPEWELL breaks the data types down into the following categories: communications, economy, education, food and water, government, healthcare and public health, housing, nurturing and care, transportation, well being, preparedness and response, countermeasures, engineered systems, deprivation, inequality, vulnerability, resources for recovery, and social capital and cohesion.3 By incorporating multiple data points in each of those categories, COPEWELL provides one of the most comprehensive views of community resilience available. The model considers everything from household income to public transportation to arts programs.
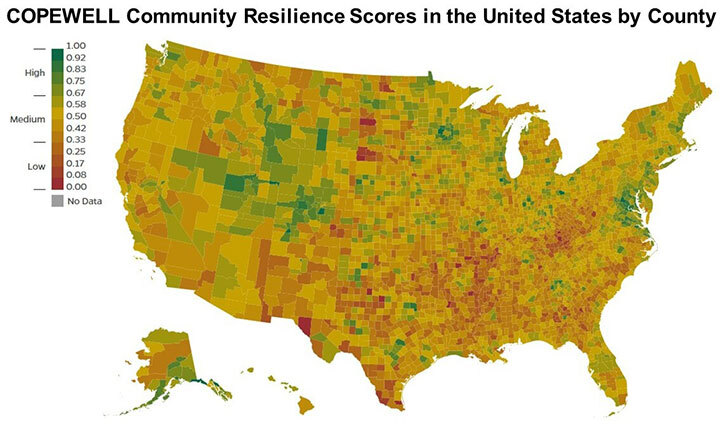
All of these data are entered into the COPEWELL model, which then provides a resilience score between 0.00 and 1.00, as shown above for all U.S. counties. Clearly there is a lot of work to do in a majority of the country.
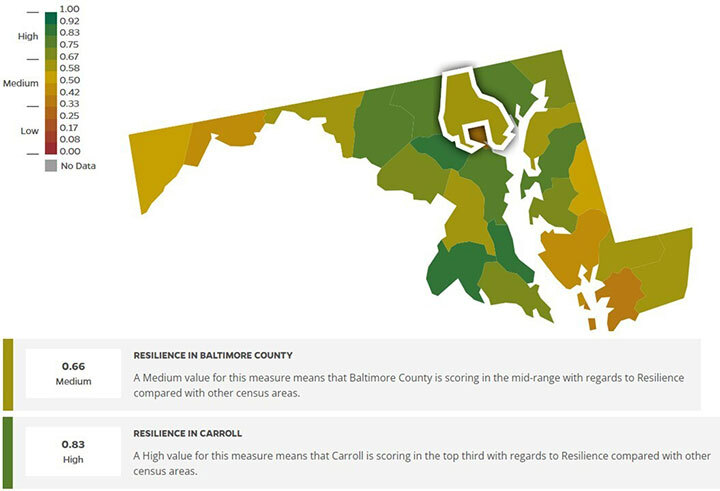
The critical question then becomes: what do we do with this information? This model allows communities to understand how prepared they are for a crisis, and how they compare to others. Focusing on Maryland (below), Baltimore County has a resilience score of 0.66, which is lower than neighboring Carroll County, which has a score of 0.83. This could indicate that there are programs or policies that differ between the two counties, making Carroll County more prepared to handle a crisis. Baltimore County leadership could then communicate with Carroll County leadership for input and advice on possible solutions to improve Baltimore County’s resilience. Importantly, there may be contributions to the resilience score outside of local leadership’s control, such as population density and political sentiment.
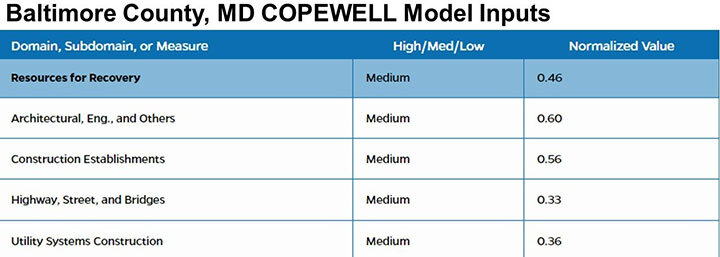
Additionally, COPEWELL provides a tabular breakdown on each data point in the model, informing communities where weaknesses lay, and highlighting a path to improvement. Sticking with Baltimore County, the excerpt from the table below shows that while there is availability of construction companies (0.56/1.00), the county’s infrastructure is quite poor (0.33/1.00). This can be incredibly helpful information for local leaders deciding how to prioritize the allocation of funds.
I strongly believe that better data is key to better governance. COPEWELL provides actionable data for community leaders looking to improve their ability to survive and respond to crises in light of the COVID-19 pandemic. COPEWELL is an open resource to all and provides clear instructions for using the model and interfacing with the team.
On a national level, the U.S. Centers for Disease Control and Prevention’s Center for Preparedness and Response has been a key partner in the COPEWELL model, but there is little evidence that this data was used in the planning and response to COVID-19. Therefore, the burden may lay on individual communities to bolster their public health emergency preparedness as much as possible without federal oversight and support. This is one of the rare instances where we may already have access to all the data we need to start making important policy changes. If each community commits to improving its public health preparedness — through sometimes very simple changes — then hopefully we will not have to experience another public health crisis as severely as we did with COVID-19.
References
1. Office of the Assistant Secretary for Preparedness and Response, Community Resilience, 09 June 2015. https://www.phe.gov/Preparedness/planning/abc/Pages/community-resilience.aspx. (Accessed 03 May 2022).
2. N. Thomas, B. Goodman, The US is in 'transition phase' of pandemic, Fauci says, 27 April 2022. https://www.cnn.com/2022/04/27/health/fauci-covid-pandemic-phase/index.html. (Accessed 03 May 2022).
3. Composite of Post-Event Well-Being (COPEWELL) Johns Hopkins University, Johns Hopkins COPEWELL Model Measures Summary Sheet. https://www.copewellmodel.org/pdfs/COPEWELL-summaryof-measures.pdf. (Accessed 02 May 2022).
Images from COPEWELL Copyright © 2022 Johns Hopkins University